Documentation
CFD
Tutorials
UI
UTCI
In this tutorial is a guide of how to use Compute to run an UTCI simulation.
Universal Thermal Climate Index or UTCI is a combination of air temperature, mean radiant temperature, wind velocity and vapour pressure (relative humidity)
- Ta is ambient air temperature.
- TMRT is mean radiant temperature.
- Uwind is wind speed.
- pvapour is water vapour pressure.
The ambient air temperature and vapour pressure can be obtained from a weather file, while both wind velocity and mean radiant temperature are highly dependent on spatial context and therefore should be simulated.
To read more about UTCI, see our article on UTCI sensitivity
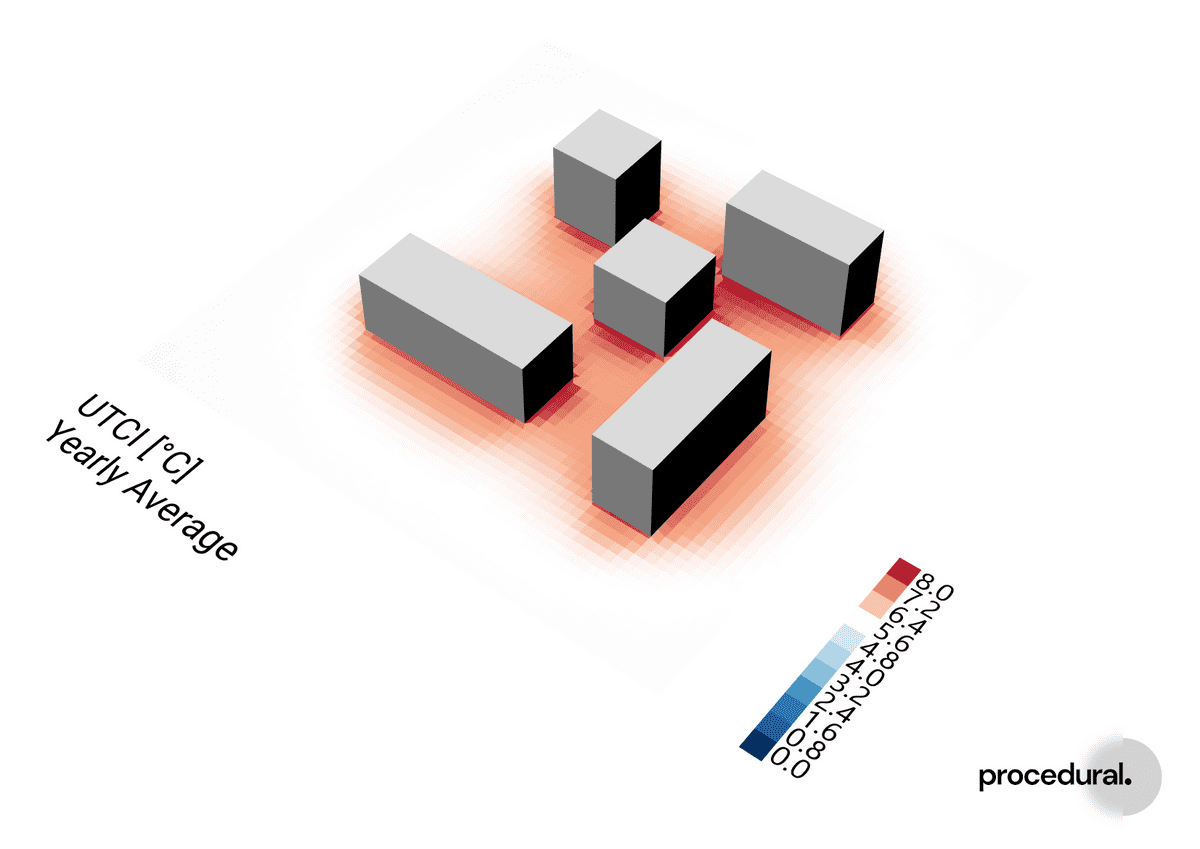
Our goal for this tutorial is to provide the user with a spatial representation of the UTCI for a group of buildings in the form of a colored mesh.
As this builds upon other analysis types that is available on Compute, we highly recommend readers to familiarize themselves with the workflow and concepts before attempting run this simulation.
To follow along or to try it yourself, download our demo file of this tutorial.
We have 4 steps to go through:
Canvas
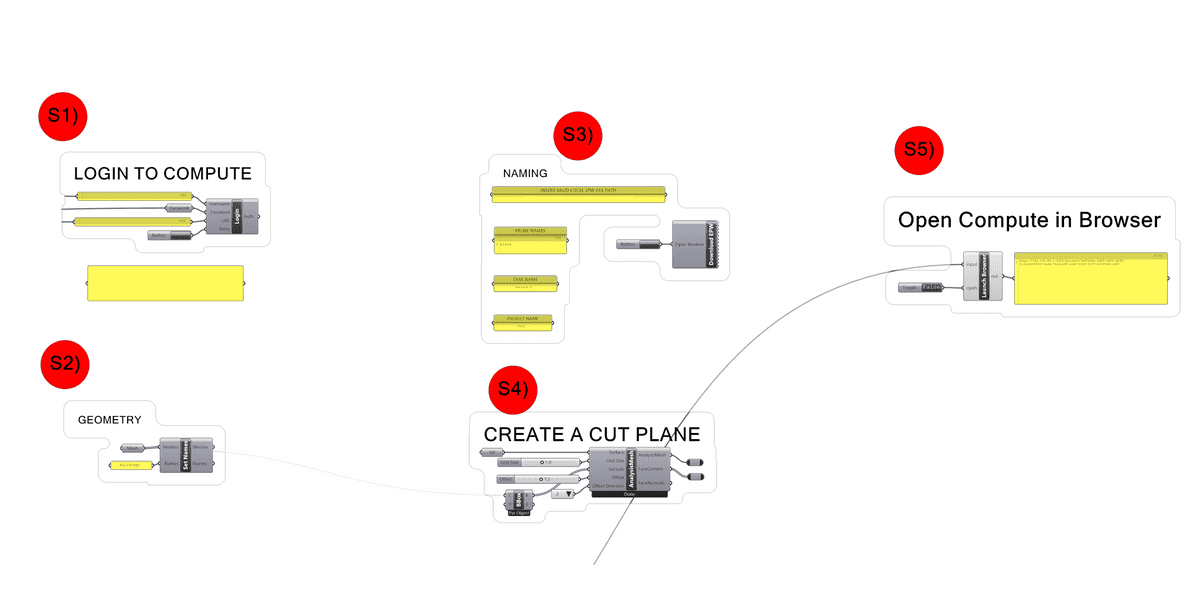
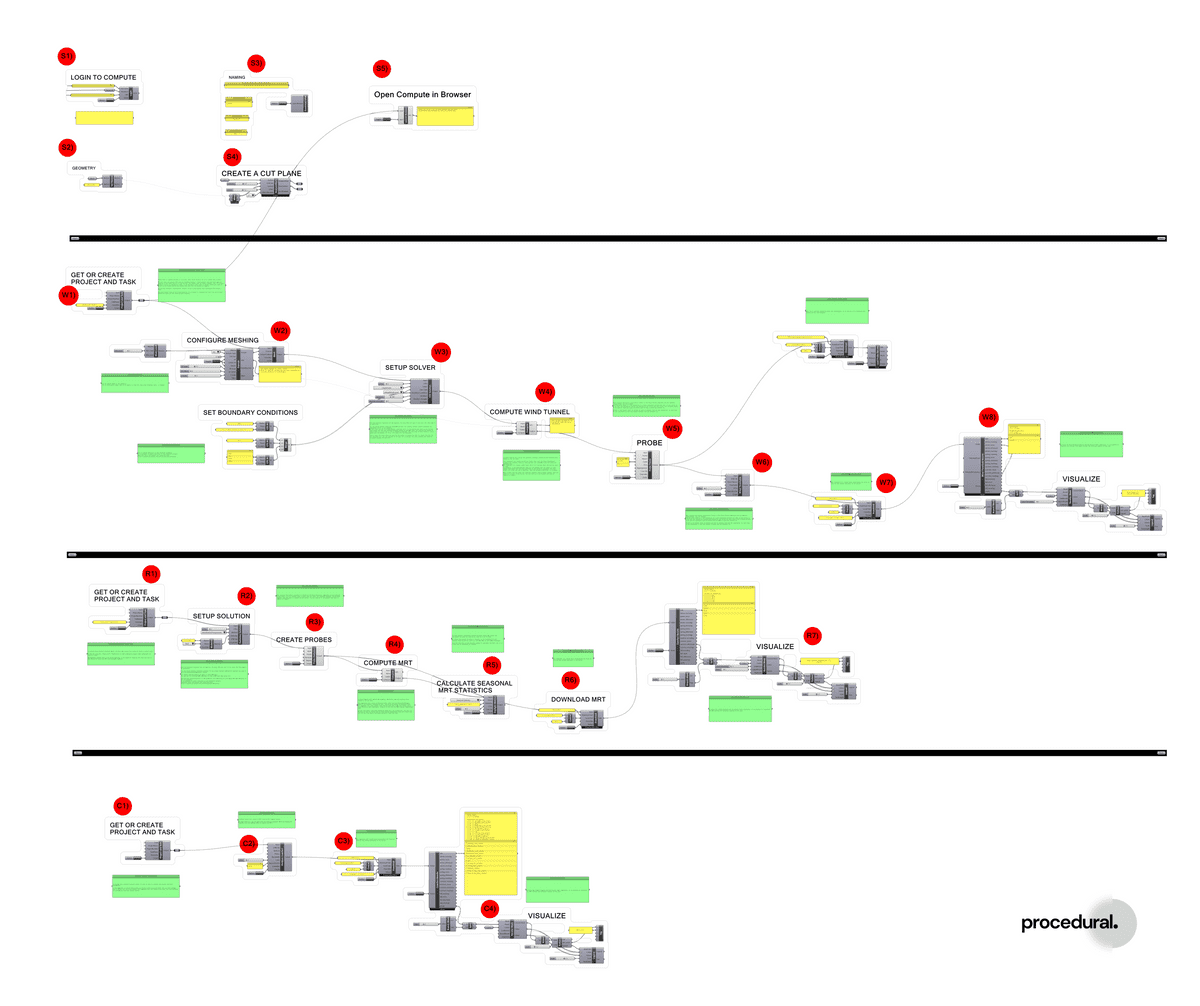
The Grasshopper canvas looks as the picture below.
Setup
In this part of the script we define some common elements that are used in the other sections.
Login
The first thing to do is to log in with your username and password. If you don't have an user for Compute yet, then you need to sign up first. You can go to our registration page to do so.
Geometry
We also import the geometry and assign names to it. If you have tried some of our other demos then you will be familiar with the geometry we use for this case.
Naming
We have several names that are used throughout the file.
Project Name: This is the project name that we will run the simulations task under.
Task Name: This is the parent task name, which we organize all simulation task under.
Probe Names: We give a descriptive name to our probes.
EPW File: A valid EPW file needs to be references here. If you do not have a EPW file, then you can download one by clicking on the Download EPW component.
Probes
We use the AnalysisMesh component to create a mesh, whose face centers we use as probe points. The mesh we will also use to color the results onto.
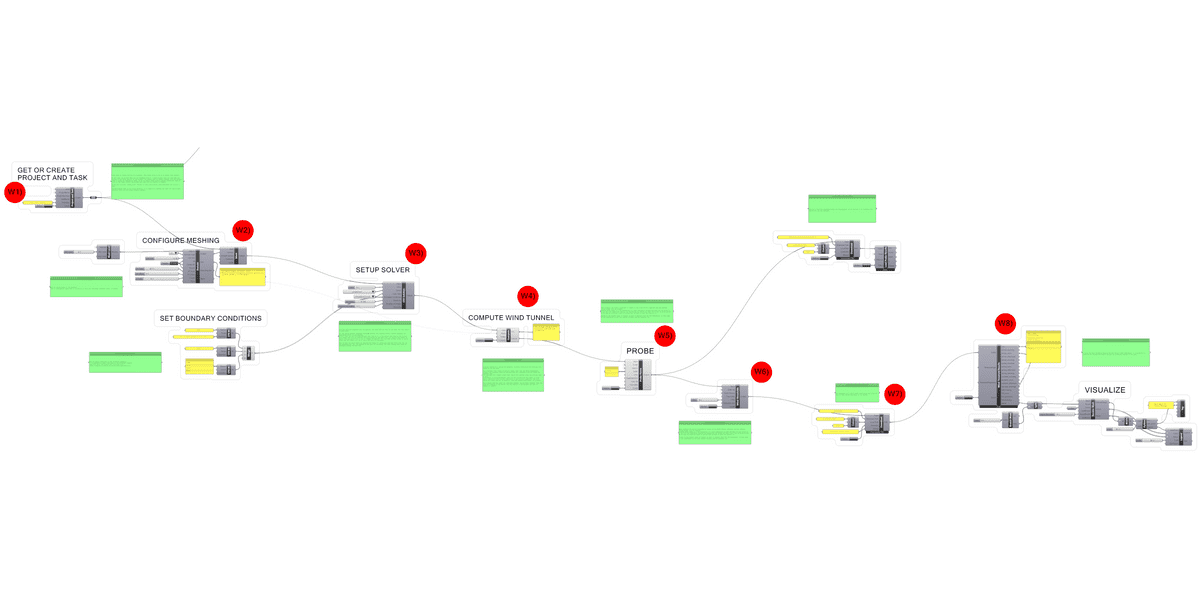
Wind Analysis
Create task
Every task on Compute belongs to a project. Then first thing to do is to create that project.
We will call our project UTCI and our TaskName Version 1 (both project name and task name are defined in the setup section of the script). The parent task we create together with our project works to group our simulation tasks, so we can easily keep track of design iterations. When we click on the Create button the project and task will be created on Compute.
We add the override: {"nest_with": "Wind"} to add a Wind parent task underneath the Version 1 task.
The Wind parent task is not doing anything. It is simple to organize the task list and to have Radiation tasks and CFD tasks grouped together.
Mesh Setup and Solution
We are going to set up the CFD simulation as a virtual wind tunnel and use the results from there to run the Threshold calculation to get hourly wind velocities for every point in our probe set.
The approach we use is identical to other Compute demos.
Visualize Results
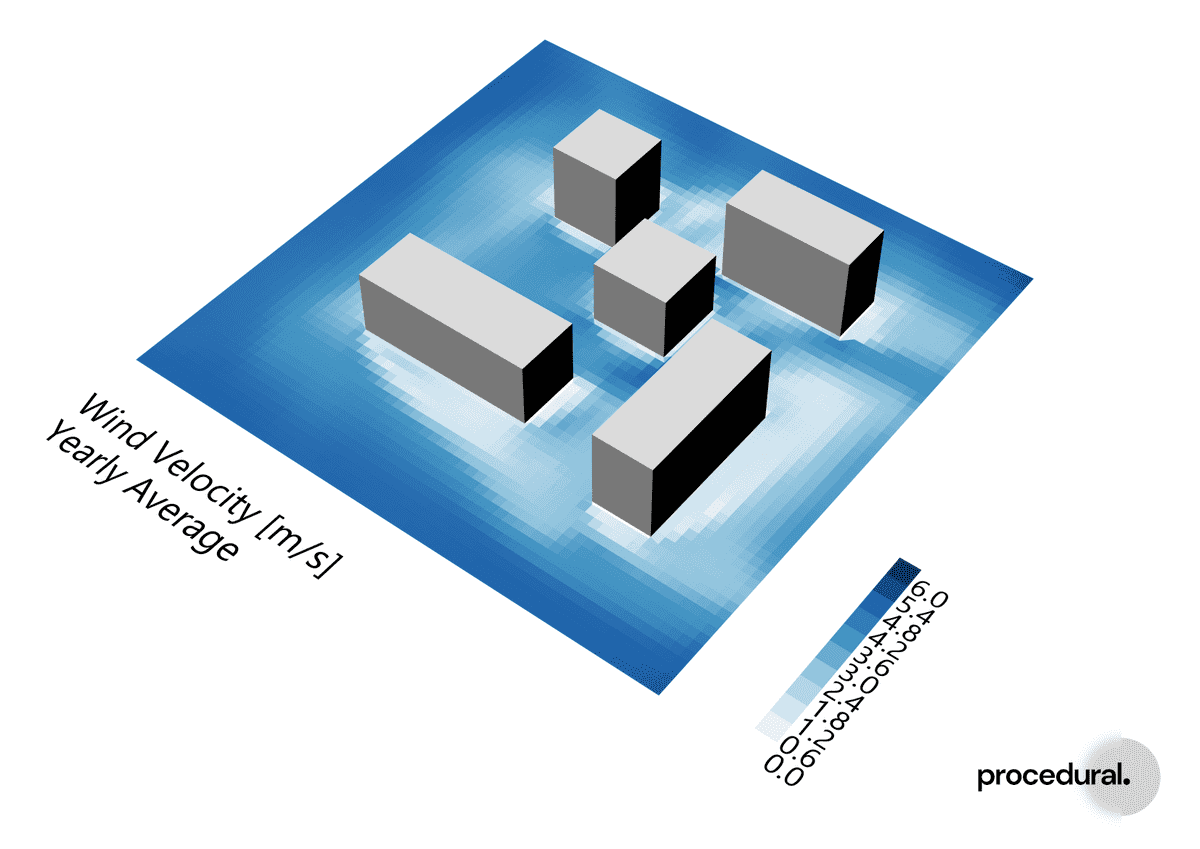
When the CFD simulation is done we can visualize the average annual wind velocities for the site.
Mean Radiant Temperature Analysis
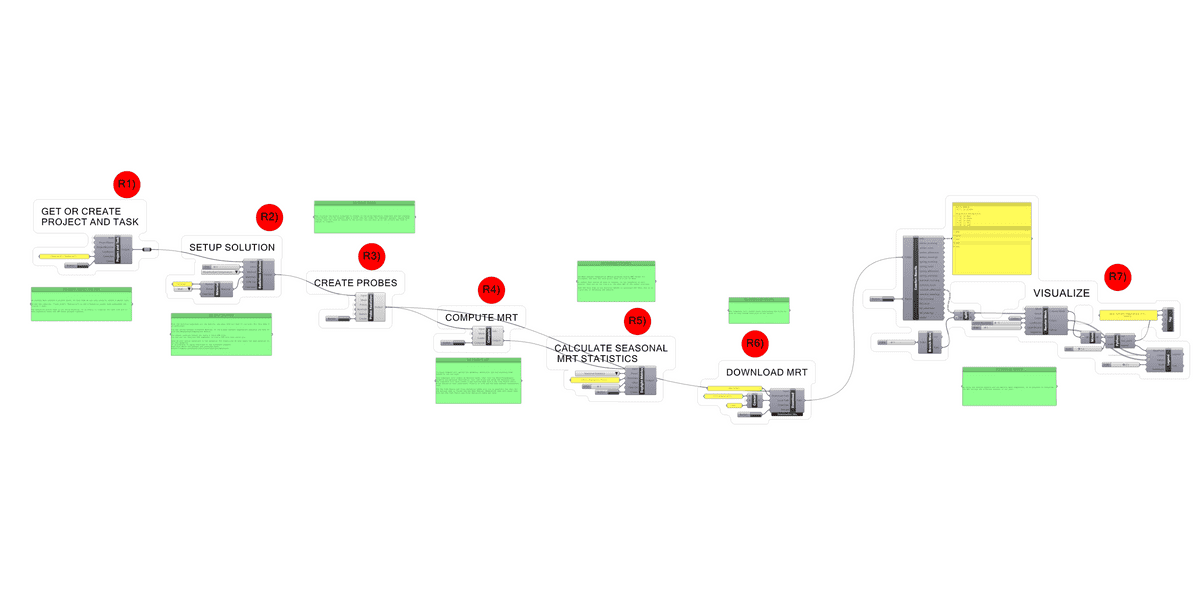
Task
We already have created a project above. So this time we are only going to create a parent task.
We add the override: {"nest_with": "Radiation"} to add a Radiation parent task underneath the Version 1 task.
Setup and Solution
The setup and solution is almost identical to that of the Solar Radiation Tutorial. Instead
of choosing SolarRadiation as the Method we pick MeanRadiantTemperature.
Seasonal Statistics
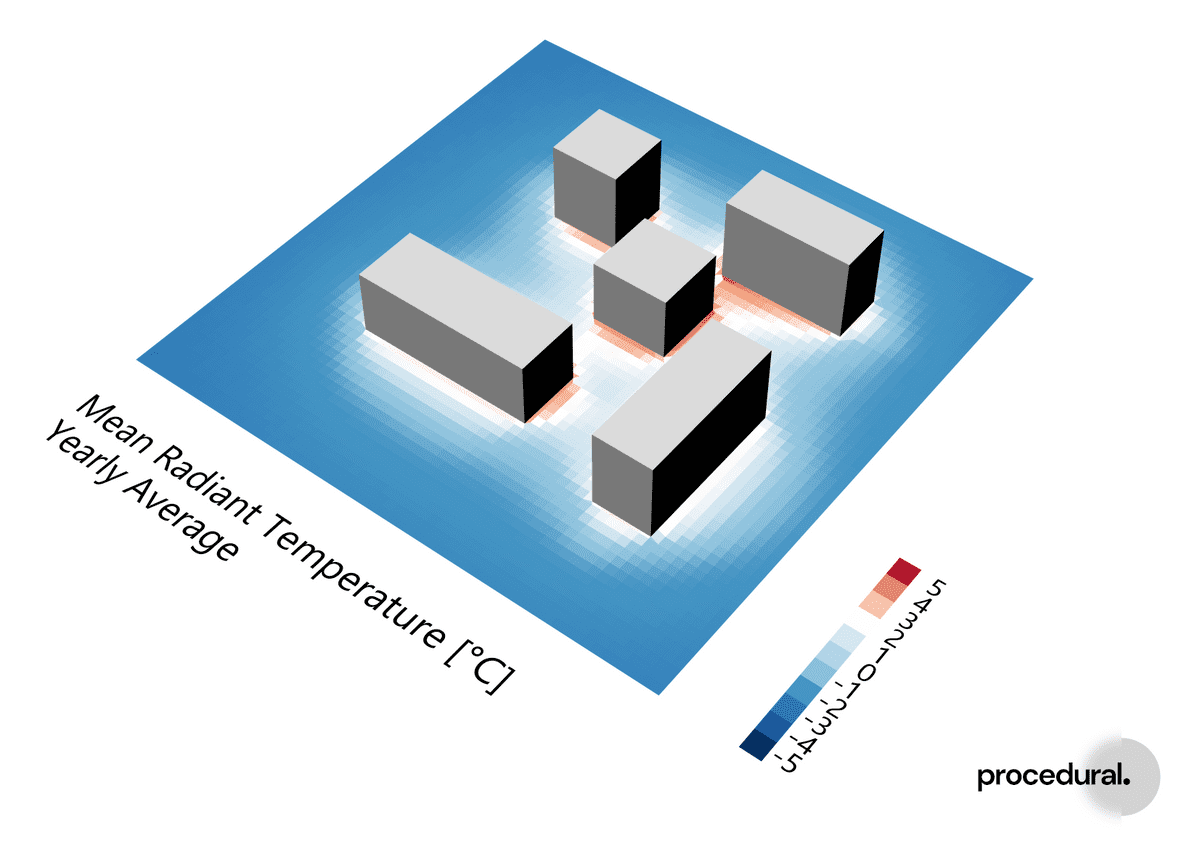
The Mean Radiant Temperature analysis produces hourly MRT values (°C) throughout the year for each point. To reduce that amount of data to inspect, we can transform it into seasonal groups. That way we can view e.g. the mean MRT of the summer evenings.
Note this step is not strictly needed to calculate the UTCI, but it is a good way of verifying the results.
Visualize Results
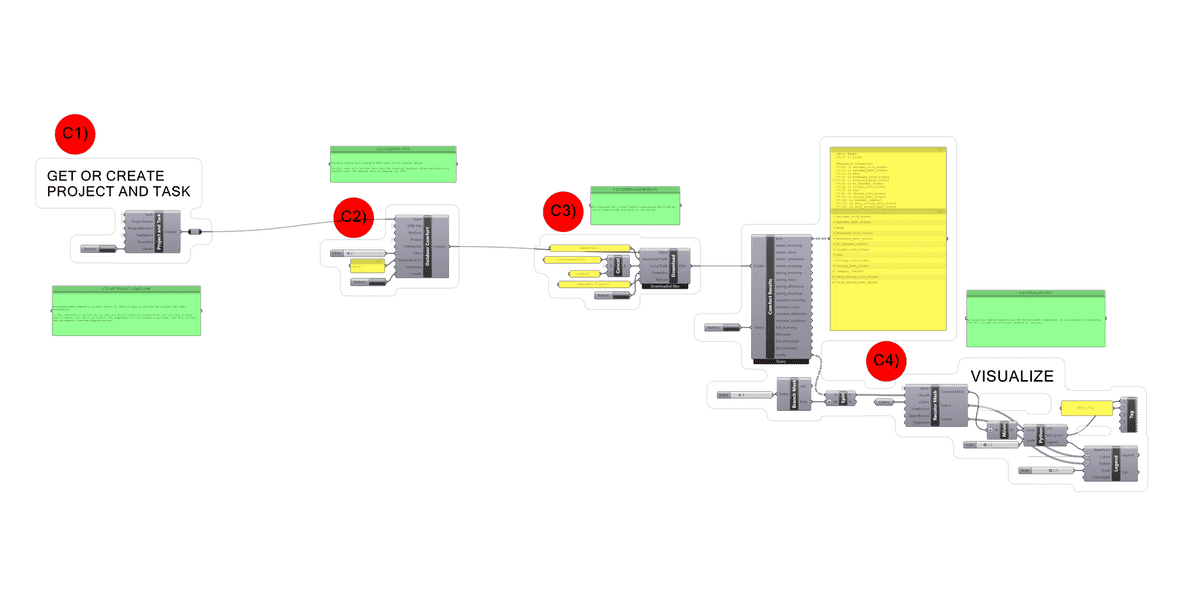
UTCI Analysis
Task
We already have created a project above. So this is only to retrieve the project and task information.
If the component is yellow saying that you should create a project/task, but you have already done it above, you can click Create. The component will not create a new task, but only retrieve the information from the Compute server.
Compute UTCI
We use the Outdoor Comfort component to create the final piece in the comfort puzzle the UTCI task. The comfort
component needs input on EPW file path and which probes it should calculate on. After the task have run the results can
be downloaded and visualized just as the other analysis types.

